Earth’s average temperature has risen by 1.4°F over the past century, and is projected to rise another 2 to 11.5°F over the next hundred years. It is believed that recent global warming is primarily a result of greenhouse gas emission.
Climate change is one of the biggest challenges facing the world today. It is a phenomenon that has been caused by the increased emission of greenhouse gases such as carbon dioxide, methane and nitrous oxide from human activities. These gases trap heat in the Earth’s atmosphere, leading to a rise in temperatures and changes in weather patterns. Climate change poses a significant threat to human health, natural ecosystems, and economies across the globe.
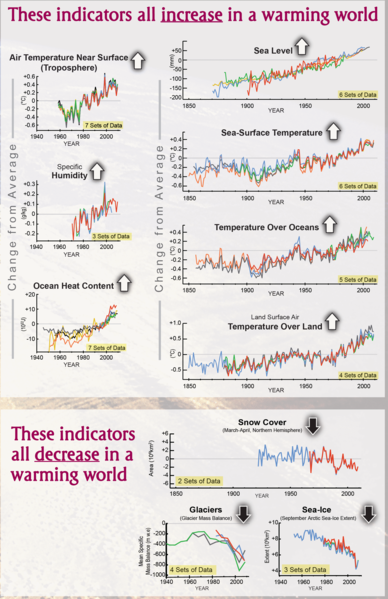
The impacts of climate change are already being felt around the world. Rising temperatures are causing ice caps to melt and sea levels to rise, resulting in coastal flooding and erosion. Extreme weather events such as hurricanes, droughts, and wildfires are becoming more frequent and intense, causing significant damage to infrastructure and livelihoods. The changing climate is also affecting agricultural productivity, water resources, and biodiversity, leading to food shortages and ecological imbalances.
The main cause of climate change is the burning of fossil fuels for energy production, transportation, and industrial processes. Other human activities such as deforestation and intensive agriculture also contribute to the problem. The good news is that there are ways to mitigate the effects of climate change. Governments, businesses, and individuals can take action to reduce greenhouse gas emissions and adapt to the changing climate.
|
Today’s Air Quality Global Air Quality Map |
|

Current Sea Surface Temperature Anomaly
|
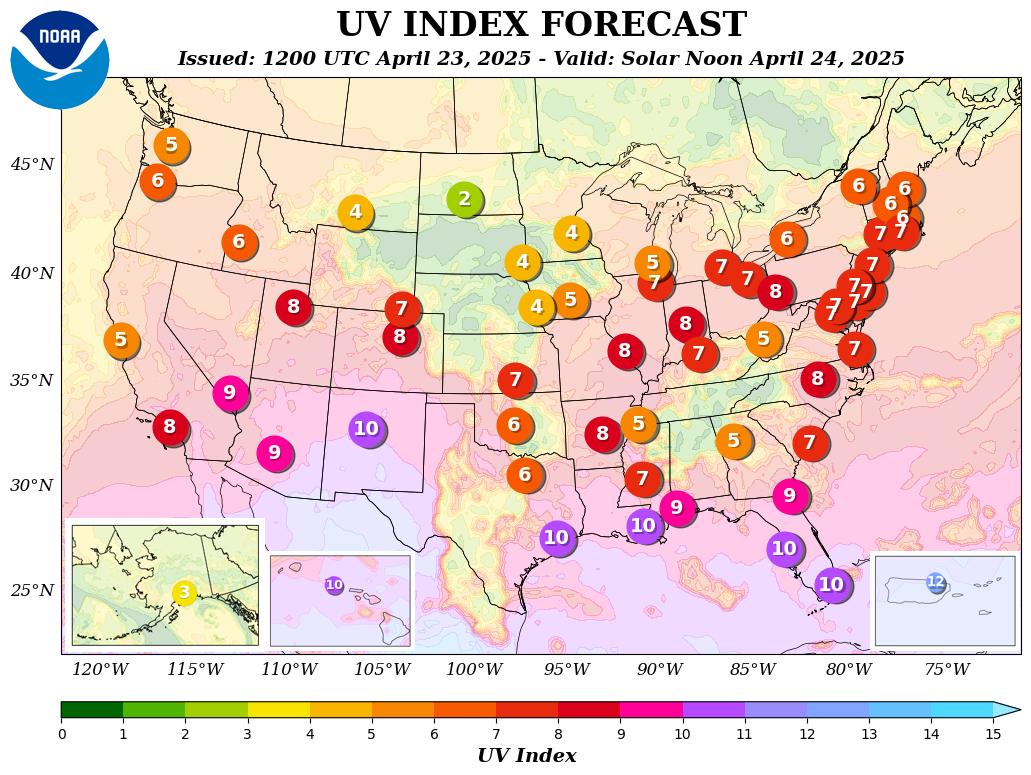
Charts and Maps |
Global Warming Sites EPA Ozone Hole Watch USGS Global Change Global Warming Org Greenpeace |
|
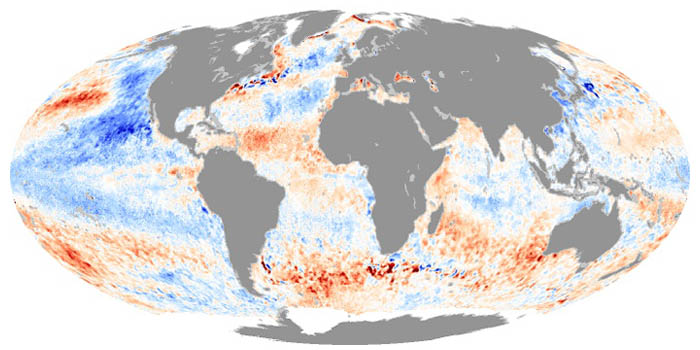
Sea Surface Temperatures